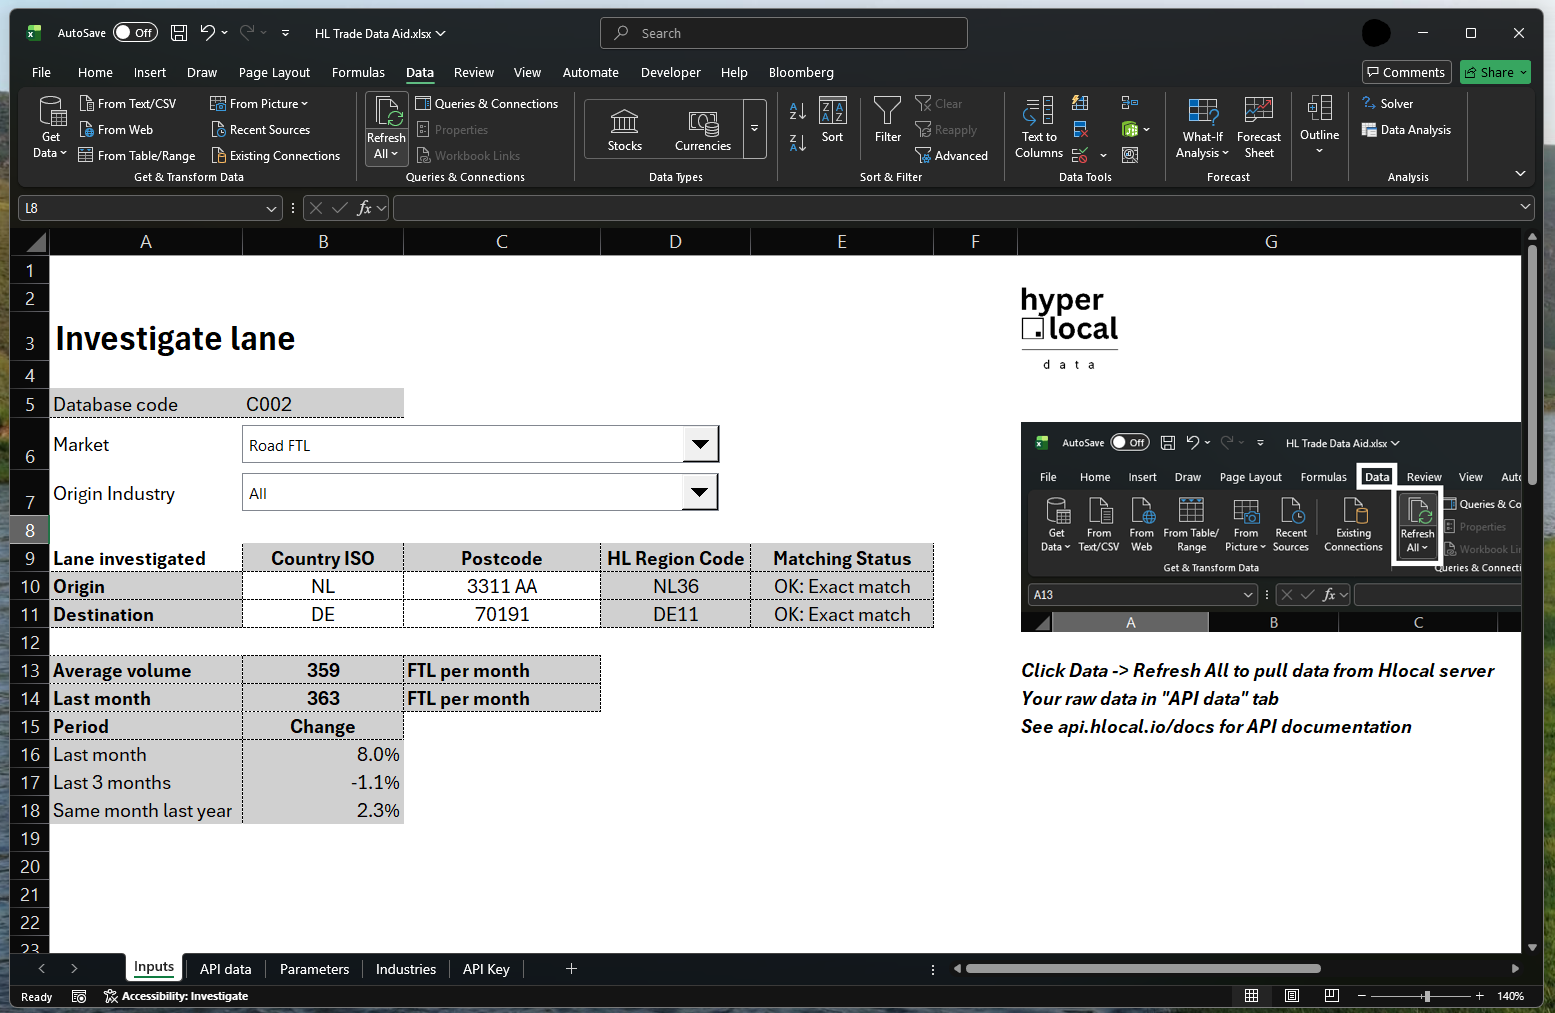
Along with API key you can download HL Trade Data Aid.xlsx
Type in the postcodes in Excel, hit Refresh Data and get historical monthly average region-to-region shipments.
Repeat to compare it to the lanes you know, so you can understandwhat margin to add.
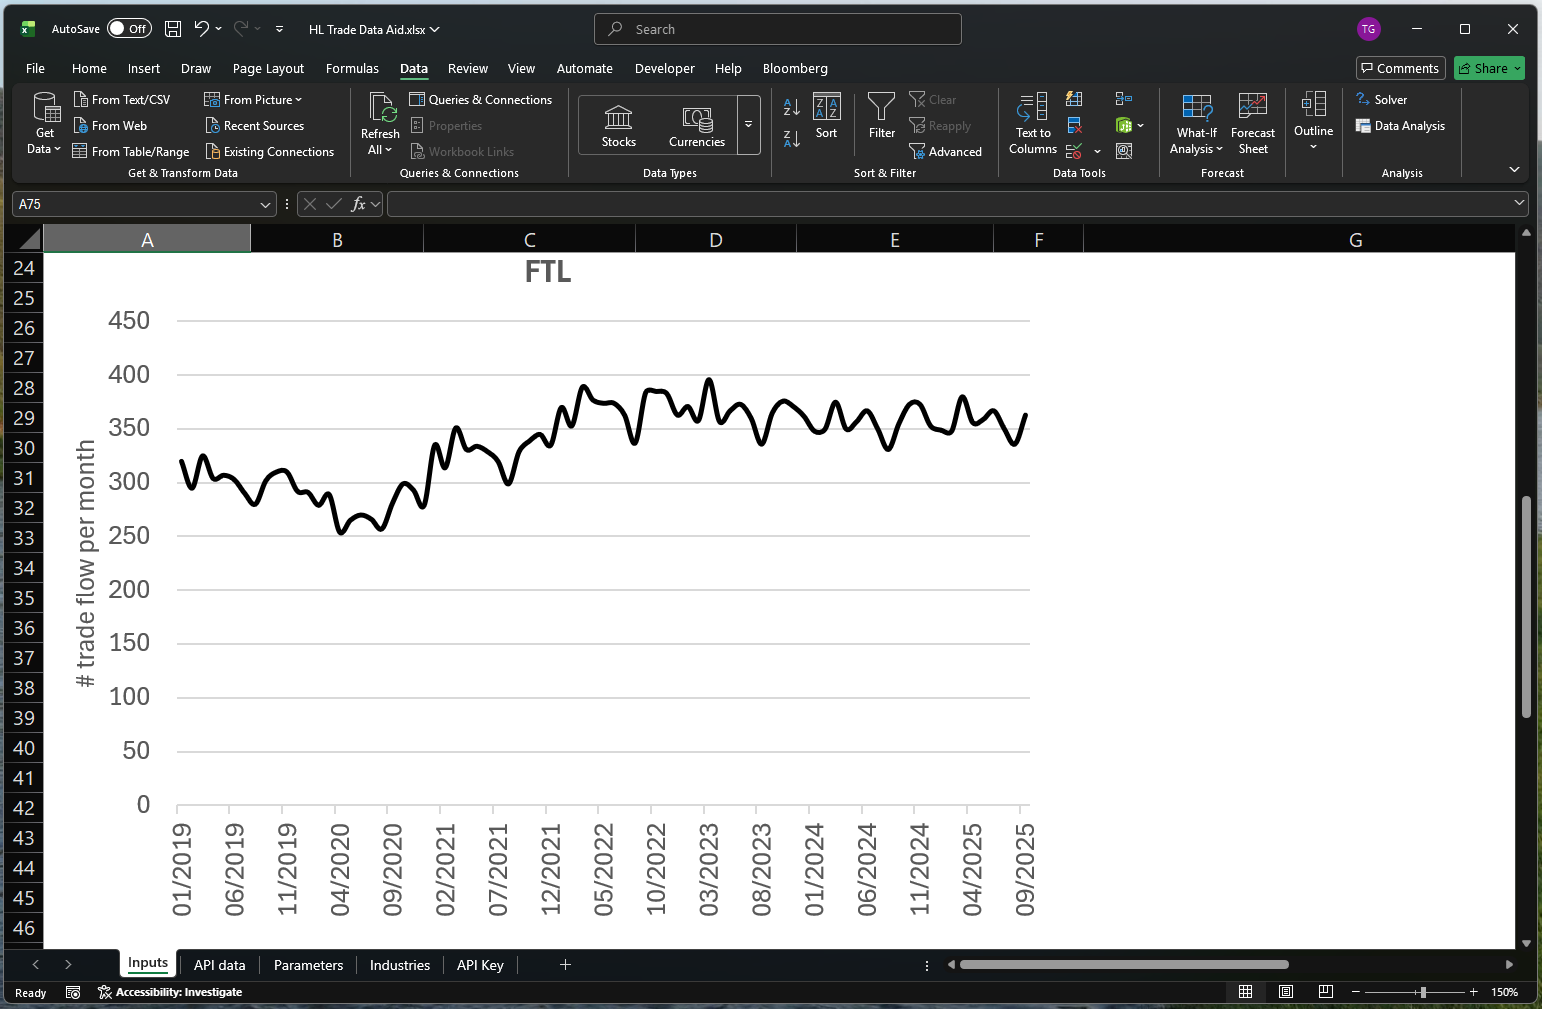
Access monthly history from 2019 to assess the seasonality and the recent growth trend.
Raw data is available in Excel to carry out additional analysis.
Data series are not seasonally adjusted, so you can observe the expected seasonality too.
Where does the truck/container go after the destination? Manage the best lanes for the onward freight to limit the empty miles.
Get Started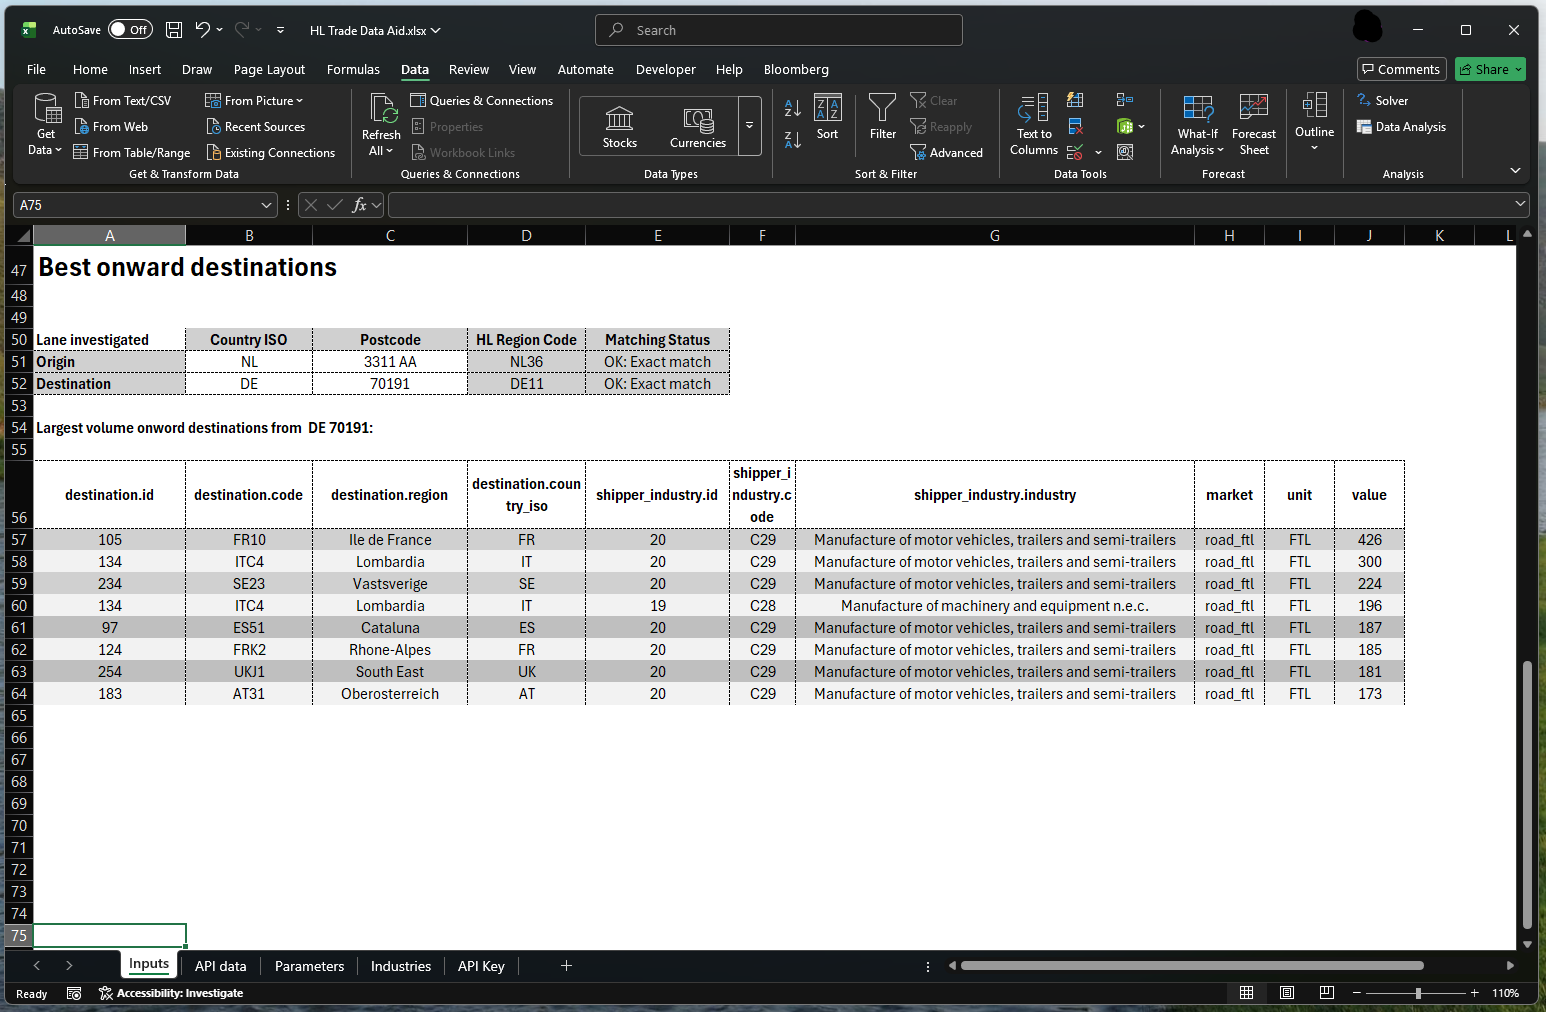
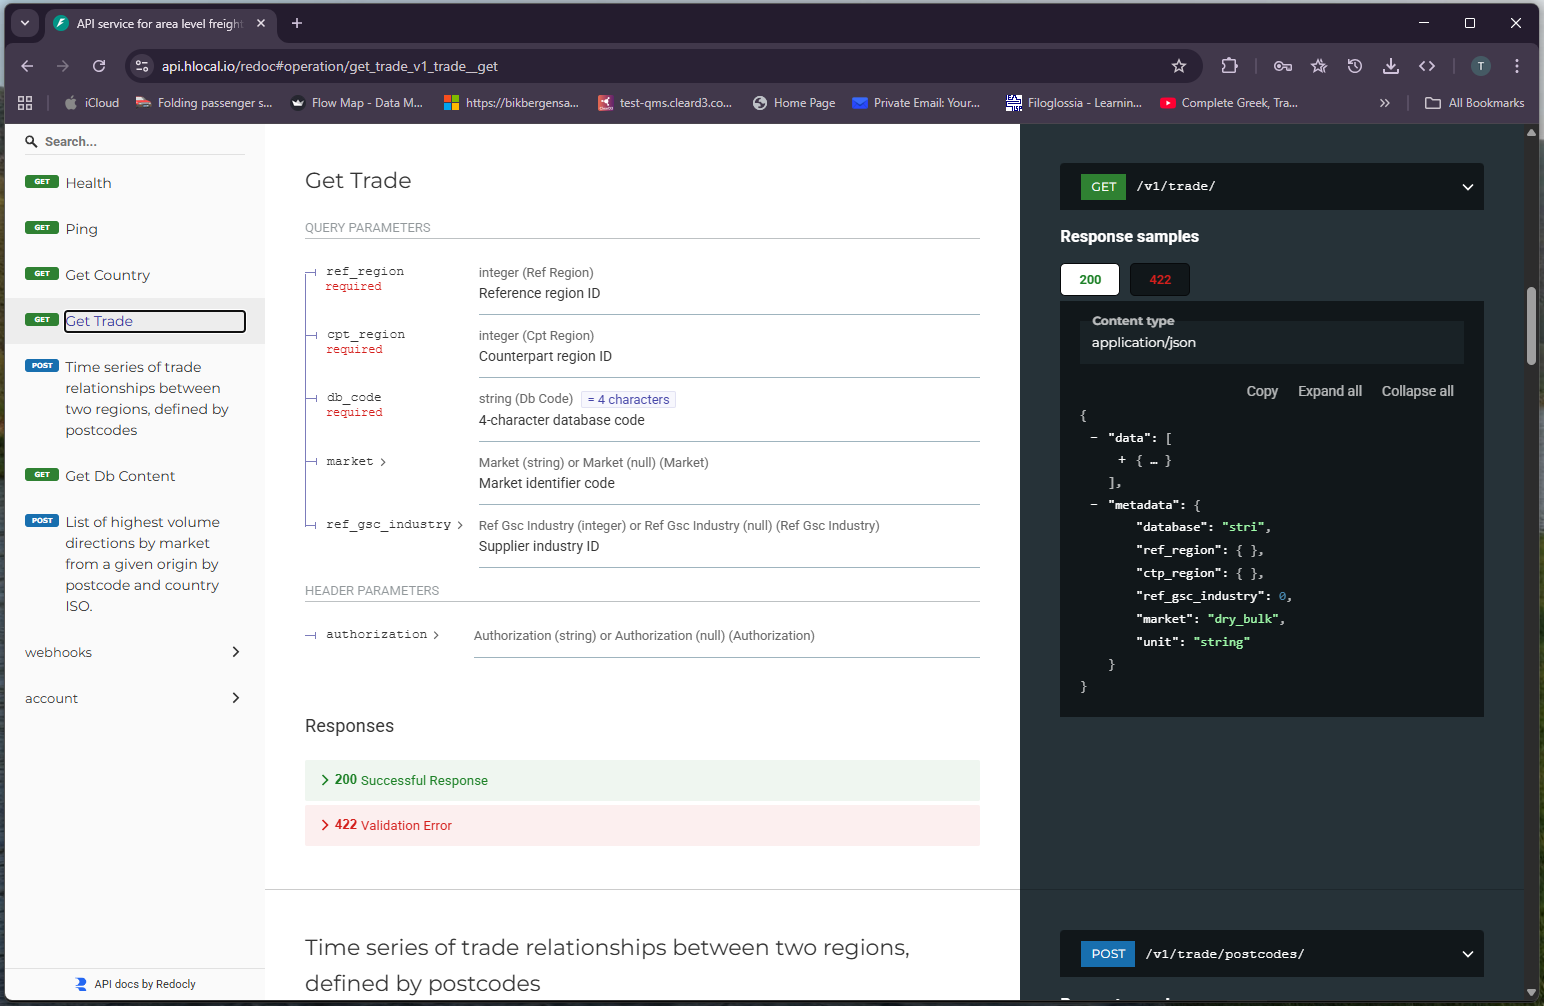
Integrate the data with your sales cycle and data flow using HL Rest APIs.
Get Started